Image Analysis
Image Analysis
HARDWARE
Apple MacBook Pro
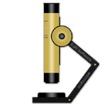
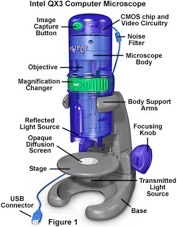
Intel “QX3” Microscope
Epson 1200 Flatbed Scanner
Fuji Finepix S7000 Digital Camera
JVC GR-D725E Camcorder
SOFTWARE
Quicktime Pro
Graphics Converter
Apple iMovie
Apple iPhoto
MixScope
ImageJ


Examples
Waveguide coupling vs auto-fluorescence due to internal reflections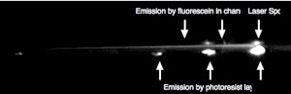
Auto-fluorescence of the materials used to fabricate resist based micro-channels can often mask the desired signal.
In order to determine the relative strength of the signal-to-noise, digital images were obtained to illustrate the effect, and data was extracted from this image to allow generation of a 3D.
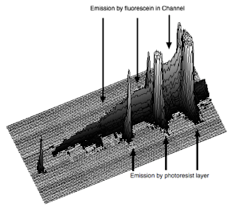
From these images it is easy to see the intensity of the signal vs the noise response, and the use of the 3D plot offers a more representative method to display the data.
Hydrodynamic Flow
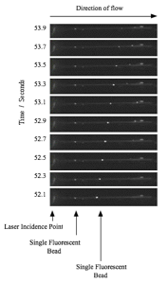
This is an example of hydrodynamic flow in a microfabricated waveguide channel.
The waveguide is formed from a low refractive index liquid core with high index boundaries, making it a lossy system.
Fluorescein labeled microspheres flow at a constant velocity through the structure, aided by a syringe pump. Laser induced fluorescence is used to excite fluorescent emission image the beads in darkfield mode and the video was recorded at 15 fps using PC capture card and a CCD camera.
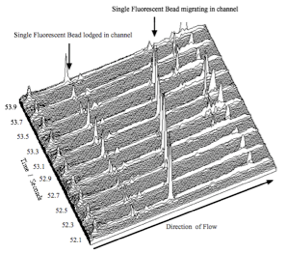
The movie file was converted to individual frames, and following this, data was extracted from each frame to allow for a 3D representation of the image to be constructed.
The 3D data plot provides a far superior illustration of the data than the 2D digital images.
Ref:
RJ Holmes and NJ Goddard.
A low cost imaging suite for microfluidics analysis, Chips and Tips: Lab-on-a-Chip, 5th February 2007. (http://www.rsc.org/Publishing/Journals/lc/Chips_and_Tips)