Department of Instrumentation And Analytical Science.
M.Sc. Laboratory Course
Experiment 5: High Performance Liquid Chromatography (HPLC)
Introduction
High performance liquid chromatography (HPLC) is a highly efficient liquid phase separation technique, utilising a mobile (liquid) phase pumped at high pressure through a stationary (solid) phase. The stationary phase consists of microspheres of material packed tightly into a stainless steel tube (column). Samples (analytes) are loaded onto the column via a rotary valve loop injector by the operator and are transported to and through the separating column by the mobile phase, which is pumped by a dual reciprocating pump to provide pulse free flow. As the analytes flow onto the column, they are partitioned between the mobile and stationary phases, with the interactions defined by the type of HPLC used, the analyte properties, and the composition of the mobile phase.
The result of the partitioning process is that some species will be retained on the column longer than others, depending on the strength of the interaction with the stationary phase. Eventually, all components will emerge (elute) from the exit of the column, and an ideal system would have all analytes emerging as a series of time resolved bands, or zones of concentrated material. Each zone will approximate to a Gaussian distribution in terms of concentration or the component in the mobile phase as a function of time. Normally, the emerging bands are monitored using a detection device, which responds to either the analytes general physical characteristics (a Universal detector – e.g. UV/Vis Absorbance), or a specific characteristic (a selective detector – e.g. Fluorescence).
The detector should respond to each component eluting from the column with a linear relationship to the component concentration. In this way, the concentration may be determined by the use of a series of standards solutions of known concentration, with a detector response profile for each component being obtained, and the unknown calculated from this profile.
The apparatus used in this study incorporates an UV Absorbance Detector, and here the mobile phase (Methanol: Water) is transparent to the wavelength used (254nm). The analytes by contrast absorb UV radiation sufficiently strongly to be monitored.
The efficiency of the separation process includes a consideration of the ‘sharpness’ of the elution bands, or peaks; the degree of separation between the adjacent peaks (a measure of the baseline separation); and the rate at which analysis can be conducted. The principle aim of this experiment is to investigate some of the chemical and physical parameters, which affect the separation process, and hence govern the efficiency of the sample analysis. As part of this experiment, you will be expected to optimise the chosen parameters to give rapid and well defined (well-resolved) separation of a test mixture containing four components in a methanol solvent.
Background
The apparatus consists of a solvent (mobile phase) reservoir; a high pressure dual reciprocating pump; a rotary injection loop (Note: only use the syringe provided to load the loop – do not use a syringe with a sharp end!); a separation column; a UV detector - single wavelength (254nm); a chart recorder; and a waste collection bottle. Identify the components and seek advice from a demonstrator concerning the operation of the equipment, and the handling and disposal or the samples and solvents.
YOU MUST READ AND SIGN THE COSHH SAFEY FORM BEFORE PROCEEDING. (If you do not understand the safety implications, you MUST seek assistance from a demonstrator, or a member of staff.)
Before you proceed to the experimental section, read the introductory chapter from J.H.Knox, “High Performance Liquid Chromatography”, Edinburgh University Press, 1978. (A photocopy of this is provided in the laboratory, DO NOT REMOVE THIS. The book is also available from the UMIST Library.
Experimental
The HPLC instrument is fitted with a Spherisorb C18 column – 5cm long, 4.3-mm i.d, with a packing particle diameter of 5um. The mobile phase is a 50:50 mixture of methanol and water. If insufficient mobile phase is supplied, it must be prepared prior to commencing work, using distilled water, and HPLC grade methanol.
The settings on the chart recorder should be 1cm/min, with a range of 10mV. The detector should be operated on an attenuation of setting of 1.0 AUFS, however may require changing to 2.0 AUFS, depending on the quality of the response.
A test mixture of 2.4% Acetone, 2.2mg/ml phenol, 0.06% nitrobenzene and 1.2% toluene in methanol is provided.
The mobile phase should be degassed with nitrogen prior to use; to prevent any air bubbles forming within the HPLC system. The degassing stage should take approximately 10 minutes, and should be repeated at the start of each experimental session, and when the mobile phase is replaced. Degassing MUST NOT occur whilst the pump is operating. The mobile phase should always cover the inlet filter.
The pump should be started at a flow rate of 2.0ml/min, and the detector should be switched on. The sample loop is a constant volume device, with a sample volume of 20ul. The loop should be filled, until the excess is observed in the waste contained situated at the rear of the loop. This sample should be injected onto the column, via a clockwise motion (180 degrees) of the valve. After 10 seconds, the loop should be returned to the load position, and the syringe removed. The injection motion must be a fluid, to minimise disturbances to the flow of mobile phase. A disturbance of the flow in this means can result in increased back-pressure, which can trip the safety cut-off on the pump, and render the particular run invalid. As the sample is injected, the chart recorder must be marked to indicate the injection.
Observe the components as they elute, and once the third component has eluted, change the speed of the chart recorder paper to 12cm/min, and mark the chart to indicate this. This will facilitate the quantitative measurements, which will be conducted on the fourth peak.
The whole process must be repeated until at least three similar chromatograms have been obtained, and this method must be used for the following two experimental sections.
Experiment 1 – Calculation of Column Efficiency
Although equ. 2.7 (Knox) gives the column efficiency in terms of the width of the base of the peak, it can also be calculated in terms of the width at half maximum height, W1/2, as:
N = 5.54 (tr / W1/2) 2
Since this is much easier to measure. tr, the retention time, is measured in the same units at W1/2, i.e. chart mm.
From the chromatogram, using the last peak, you can calculate: -
The number of theoretical plates for the column (N),
The height equivalent to a theoretical plate (H). (equ. 2.6)
Experiment 2 – Determination of the Optimum Flow Rate.
Chromatograms should be obtained for flow rates of 0.5, 1.0, 1.5, 2.0, and 2.5 ml/min, and the Van Deemter plot of log v Vs log h should be plotted. (Equ. 2.27)
Calculate v and h for each chromatogram using the same peak as before (each time). All the required relationships can be found in Knox, and other HPLC texts.
Report the optimum Flow rate for the column. Using Dm= 6x10⁻¹⁰ M2s-1 for a 50:50 methanol: water mobile phase, and deduce to from the chromatogram. (For this experiment, t0 is equivalent to tm)
Additional Work.
Comment on: -
The elution order of the analytes, with respect to the chemical and physical characteristics.
Methods which can be used when determining t0.
Additional Suggested References
Douglas A. Skoog, James J. Leary, “Principles of instrumental analysis.” 4th ed. - Philadelphia; London: Saunders, 1992.
Douglas A. Skoog, Donald M. West, F. “Fundamentals of analytical chemistry.” - 7th ed. - Fort Worth; London: Saunders College Publishing, 1996
Gary D. Christian “Analytical chemistry.” - 5th ed. - New York; Chichester: Wiley, 1994
The HPLC system is a very sensitive instrument, and must be treated with care.
If you do not understand any part of the experiment, please consult a demonstrator.
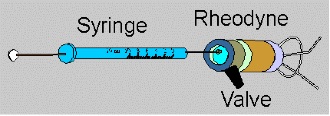
The HPLC Injection Loop
Injectors for liquid chromatographic systems should provide the possibility of injecting the liquid sample within the range of 0.1 to 100 ml of volume with high reproducibility and under high pressure (up to the 4000 psi). They should also produce minimum band broadening and minimise possible flow disturbances.
Generally, the most useful and widely used sampling device for modern LC is the microsampling Injector valve.
Because of their superior characteristics, valves are now used almost to the exclusion of syringe injection. With these sampling valves, samples can be introduced reproducibly into pressurised columns without significant interruption of flow even at elevated temperatures.
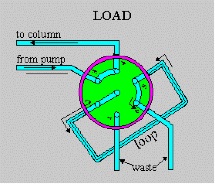
Figure above shows schematic drawings of a six-port Rheodyne valve in which the sample fills an External loop. Compared to shorter, wider i.d. sample loops, long, narrow loops are preferred when large sample volumes are required, because of lesser band-broadening effects. Alternatively, a specially designed syringe may be used to inject a small volume (e.g., <10ul) into the loop when required, although in this case the precision in the sample introduction is dependent on the precision of syringe delivery.
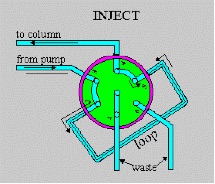
A clockwise rotation of the valve rotor places the sample-filled loop into the mobile-phase stream, with subsequent injection of the sample onto the top of the column through a low-volume, cleanly swept channel. Other valve types (e.g., Siemans and Valco) use an internal sample cavity consisting of an annular groove on a sliding rod that is thrust into the flowing stream. The minimum injection volume which can be made with the valve-type injectors is 60 nl.
Valve injection allows the rapid, reproducible, and essentially operator-independent delivery of a wide range of sample volumes (e.g., from 60 nl up to several millilitres), at pressures up to 7000 psi with less than 0.2% error. High-performance valves provide extracolumn band broadening characteristics comparable or superior to that of syringe injection. Manually operated valves are only moderately expensive, and automated versions can be obtained at somewhat higher cost. A minor disadvantage of most sample valves is that the sample loop must be changed to obtain various sample volumes, but this can often be achieved in a few minutes. Another advantage of sampling valves is that they can be located within a temperature-controlled oven for use with samples that require handling at elevated temperatures (0° - 150°C).