Ultrasound Particle Manipulation
Focusing water droplets using Ultrasound Standing Waves
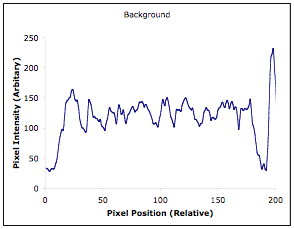
Background
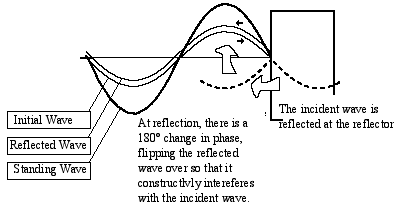
Ultrasound standing wave radiation acts on liquid and airborne suspensions to drive the phases (aerosols, particles, bubbles, oil droplets and their suspending phase) towards either nodal or anti-nodal positions. Laminar flow provides a stable environment free from turbulence this condition allows the radiation positioned phases to be freely manipulated downstream from the force field. Standing wave radiation and laminar flow have been successfully combined in liquid phases for the following applications
1)Continuous flow filtration.
2)Transfer of particles between media (washing) without a concentration step.
3)Diffusion reduction to enhance reactions of biosensors.
4)Floc formation analysis.
5)Particle positioning within gels.
The aim of this work has been to demonstrate that ultrasound standing wave radiation can manipulate particles effectively in the gaseous phase. All particles used in this study have diameters of 10 microns or less. The development of this technology for manipulating these small particles while airborne will remove the need for transferring particles to a water phase at early stages of particle analysis procedures. It is expected that many of the techniques that are underdevelopment for manipulating particles in water maybe directly transferable to operate in the gas phase.
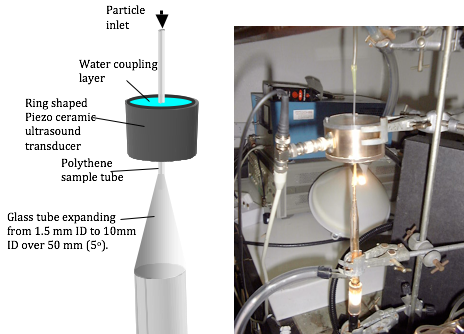
Initial trials were made using a parallel plate system, results from these trials influenced the second stage developments using a tubular system.
Procedure
•Movie images were transferred from the Sony Digital Camcorder with Firewire DV IN/Out to HD using an Apple iMac running OSX and iMovie.
•This was then exported as a QuickTime high-resolution movie, and using QuickTime Pro single frames were extracted as bitmap images (.bmp).
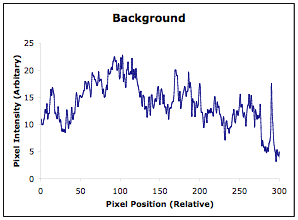
•Scion Image was used to process the images, with area plots and surface plots were taken of the result and the background images.
•Line intensity plots were obtained across the image, and this data was saved as a text data file.
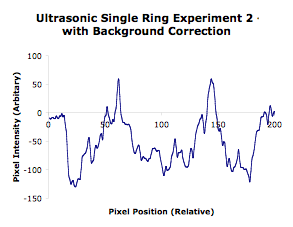
•The data files were transferred to MS Excel, where the background data was subtracted from the result data, and the results were plotted in chart form.
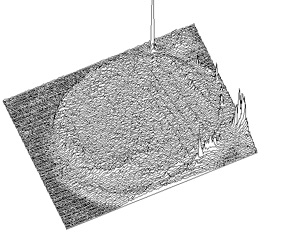
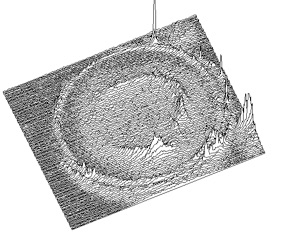
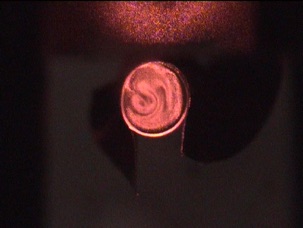
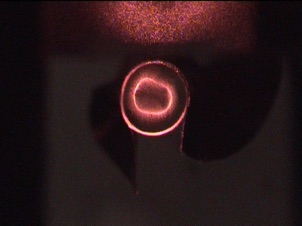
Results
Experiment 1
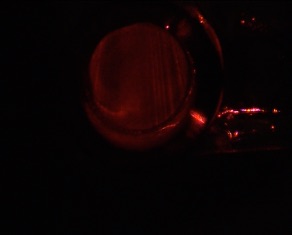
Ultrasound Off Ultrasound on
Ultrasound Off Ultrasound on
Ultrasound Off Ultrasound on
Experiment 2
Ultrasound Off Ultrasound on
Ultrasound Off Ultrasound on
Ultrasound Off Ultrasound on